The
CoCoView Resort Weather Forecast
This weather
forecast is intended for CoCoView Resort guests and applies only to
the south side of Roatan
CoCoView is at 16.4°N
Latitude x 86.4°W Longitude
in the
NW Caribbean Sea
in the
NW Caribbean Sea
CoCoView Resort, www.cocoviewresort.com
, 800-510-8164
How to use this page:
The title of each of the
figures below is linked to the page where the information originates.
Since I write and post early
in the day and generally do not update the page until the next
morning; by clicking on the link, it allows you, the viewer, to get
the latest information.
This is not only convenient
but allows you to track weather events such as cold fronts and
hurricanes from a single web page.
In addition, in the right
column is a very useful widget. It is a trip planner...yesteryear's
weather at a glance.This widget lets you check historic weather for
your trip dates.
Skies will be partly cloudy. Winds will be mostly easterly in direction at 15 mph to 20 mph this morning; increasing to 20 mph to 35 mph this afternoon and evening. Seas will be rough at 2 ft to 4 ft or higher.
Divers should exercise caution exiting and entering the boats, especially on the afternoon dives.
The air temperatures will range from the low to high 80s ºF or 26°C to 27ºC. Ocean water temperatures are 80°F to 82°F or 26ºC to 28ºC.


Fig
2a – Today's Jetstream


 |
Fig 20 - Recent changes in the
Saharan Air Layer
|
 |
The Tropical Weather Outlook
For the North Atlantic...Caribbean Sea and the Gulf of Mexico:
1. Synopsis...A tropical wave will pass through the central Caribbean today and Fri...and move across the W Caribbean on Sat and Sun. Tropical storm Danny in the central Atlantic is expected to become a hurricane...passing 55W on Sun with tropical storm conditions spreading across tropical waters E of the Lesser Antilles on Sun and across the Leewards on Mon.
All interests in the Bay Islands and on the North Coast of Honduras should track this system as it moves west towards us.
2. The Saharan Air Layer (SAL) has again decreased in area.
By:
Bob Henson
, 11:38 PM GMT on August 19, 2015
Tropical Storm Danny
might not be making the scene were it not for the help of a subtle but
important atmospheric feature, called a convectively coupled Kelvin wave
(CCKW), that’s contributed to a temporary break from hurricane-hostile
El Niño conditions. Danny has changed little over the last few hours: as
of 5:00 pm EDT Wednesday, peak sustained winds remained near 50 mph, and the latest National Hurricane Center outlook
continues to bring Danny to hurricane status, though not until Friday.
Tonight will be a good test of whether Danny can rebuild a solid
convective core after its disruption from dry air and Saharan dust over
the last 24 hours. For a more complete look at Danny and today’s other
tropical activity, see our post from earlier this afternoon and the post from WU blogger Steve Gregory.
What’s a CCKW?
CCKWs are huge impulses, spanning thousands of miles, that move from west to east through the stratosphere, typically rolling along at about 30 to 40 mph. CCKWs are centered on the equator, with their effects progressively weaker as you move toward the subtropics. Like a giant chimney, each CCKW has a broad zone of rising air at its heart, tilted toward the west as you move up. The resulting circulation (see Figure 1) favors the development of showers and thunderstorms ahead of the CCKW, as low-level air converges. The resulting storms are then supported by upper-level divergence toward the center of the CCKW, plus low-level westerlies near the equator that can enhance cyclonic spin. An eastward-moving CCKW can intersect the train of westward-moving waves rolling through the Atlantic, giving one or more of them a boost that can help them consolidate into tropical cyclones.

Figure 1. Schematic cross section through a convectively coupled Kelvin wave (CCKW). Image credit: Michael Ventrice.
Global weather prediction models such as the GFS and ECMWF can now latch onto CCKWs and preserve them as they make their way around the globe. CCKWs are nondispersive waves, meaning they tend to maintain their structure and can survive long enough to make several trips around the world over the course of several weeks. This gives them a noteworthy predictive value, but it takes some time and training to analyze CCKWs, which are too subtle to be seen with the naked eye on satellite images. One of the most useful tools is a Hovmöller diagram (see Figures 2 and 4 below), a time-versus-longitude plot often used to analyze areas where outgoing infrared radiation is consistently strong or weak. A CCKW will often foster and suppress enough clouds along its path to appear in a Hovmöller diagram, where its signal can be separated from the noise of day-to-day storminess. Sometimes a CCKW will overtake an active phase of the slower-moving Madden-Julian Oscillation, providing a twofold boost to showers and thunderstorms at that location before the CCKW moves on.
“It can be hard to see CCKWs for sure in these [diagrams], as these waves often destructively interfere from time to time with other equatorial waves and/or standing oscillations,” Ventrice told me. “Thus, you'll see a clear eastward propagation over some location, a break, then continuation of the signal over another location to the east at a later time.”

Figure 2. A Hovmöller diagram showing CCKW activity in July-August 2006 as traced by reductions in outgoing infrared radiation (encircled bands), averaged by longitude (bottom axis) over the main development region of the Atlantic (7.5°N to 12.5°N). Negative values of longitude are °W; positive values are °E. The CCKWs occur in the context of other, stronger features, so it can take careful analysis to find them. The green “D” near the center of the image indicates where and when Tropical Storm Debby became a named storm, supported by a CCKW passing from upper left to lower right through the “D.” Image credit: Michael Ventrice.
WSI scientist Michael Ventrice unraveled some of the links between CCKWs and hurricane formation several years ago, as part of his doctoral work at the University at Albany, State University of New York. He and colleagues at WSI now consult the CCKW regularly, and Ventrice has helped NHC develop code that allows the center to analyze CCKWs on a daily basis. “It seems to have really caught on among forecasters in the last three years,” Ventrice told me. For example, a forthcoming paper in Monthly Weather Review by Carl Schreck (North Carolina State University) surveys CCKWs around the globe and their role in tropical cyclogenesis.
Ventrice’s own research includes a set of three CCKW-related papers published in Monthly Weather Review in April 2012, July 2012, and June 2013. Ventrice’s dissertation is online, including an analysis of how a CCKW assisted in the formation of Tropical Storm Debby in 2006. There’s much more about CCKWs, including daily analyses, on Ventrice’s personal website. He also discussed CCKWs as part of a guest post on this blog last year.
How could a CCKW help give Danny a kick-start?
I was intrigued on Tuesday when a tweet from @MJVentrice credited a weak CCKW with assisting in the formation of the tropical depression that became Danny. According to Ventrice, this CCKW formed near the International Date Line around August 8, then amplified as it moved into the Atlantic basin. It’s now centered over the heart of the main development region, the swath of deep tropics in the north Atlantic that plays host to many of each year’s tropical cyclones. Over the last several days, this CCKW has likely enhanced low-level moisture and convection on its forward flank, in the eastern Atlantic, which would have helped nourish the easterly wave that became Danny as it came off the African coast. Only a minority of such waves make it to tropical-storm status; Ventrice believes that CCKWs are one of the key factors that can make or break such a system.

Figure 3. Tropical Storm Danny is now on the western edge of an eastward-moving CCKW, as indicated by this composite of Atlantic rain rates (shaded), departures from average wind at the 200-millibar height (vectors), and velocity potential anomalies at the 200-millibar height (contours). The velocity potential anomalies are related to upper-level divergence (blue contours) and convergence (red contours), with divergence favoring upward motion. For the latest version of this image, see Michael Ventrice’s website. Image credit: Michael Ventrice.
As Danny and the CCKW move in opposite directions, Danny is finding itself left behind. “The environment behind the CCKW can stay favorable for a couple of days, where you have enhanced low-level spinning, reduced vertical wind shear, and enhanced outflow,” Ventrice told me. (Carl Schreck’s new paper also finds that tropical cyclogenesis is favored for several days behind the crest of a CCKW.) However, Danny appears to be already feeling a lack of support, with the peak of the CCKW having long passed it by. “This may be the reason why we are seeing convection decouple from Danny this afternoon [Wednesday], as the low-level circulation associated with Danny is becoming exposed,” he said.
Fairly soon, Danny will encounter the more suppressed environment well behind the CCKW, together with the likelihood of higher wind shear and drier air favored by the ongoing El Niño regime. “I’ve seen a lot of cases where a mature tropical cyclone gets run over by the suppression behind a CCKW,” said Ventrice. “Can the hurricane create its own environment to protect itself from this?” One thing is for sure: the more latitude Danny gains, the less it will be influenced--for better or worse--by this CCKW. Meanwhile, it’s possible that the CCKW that gave Danny a boost will go on during the next week to favor development of another one or two easterly waves now over Africa, as suggested by some long-range model runs. After that, said Ventrice, “it doesn’t look like there’ll be much in the way of CCKW activity over the next two weeks.”
On Thursday morning, we’ll have a complete update on Danny, as well as Invest 93C in the Central Pacific and Typhoon Goni and Super Typhoon Atsani in the Northwest Pacific. Later on Thursday, watch for our summary of July’s global climate. In the meantime, here's a fascinating infrared loop of Atsani's core, featuring 2-km-resolution imagery from the Himiwari-8 satellite, courtesy of the University of Wisconsin/CIMSS. Jeff Masters is offline most of this week but will be fully back on board next week.
Bob Henson

Figure 4. A Hovmöller plot for May-September 2015 from the Cooperative Institute of Climate and Satellites-North Carolina (CICS-NC) showing variations in 200-mb zonal (west-to-east) wind speed by longitude over time. After August 17, the plot draws on long-range predictions from the NOAA Climate Forecast System model. Tropical cyclones over the Atlantic and Pacific are shown as lettered hurricane symbols. CCKWs are encircled in blue. A weak CCKW at lower right may have played a role in the development of Tropical Depression 11 (“E”) in the Northeast Pacific as well as Danny (“F”) in the Atlantic. Regularly updated plots are available from the Cooperative Institute of Climate and Satellites–North Carolina. Image credit:
What’s a CCKW?
CCKWs are huge impulses, spanning thousands of miles, that move from west to east through the stratosphere, typically rolling along at about 30 to 40 mph. CCKWs are centered on the equator, with their effects progressively weaker as you move toward the subtropics. Like a giant chimney, each CCKW has a broad zone of rising air at its heart, tilted toward the west as you move up. The resulting circulation (see Figure 1) favors the development of showers and thunderstorms ahead of the CCKW, as low-level air converges. The resulting storms are then supported by upper-level divergence toward the center of the CCKW, plus low-level westerlies near the equator that can enhance cyclonic spin. An eastward-moving CCKW can intersect the train of westward-moving waves rolling through the Atlantic, giving one or more of them a boost that can help them consolidate into tropical cyclones.
Figure 1. Schematic cross section through a convectively coupled Kelvin wave (CCKW). Image credit: Michael Ventrice.
Global weather prediction models such as the GFS and ECMWF can now latch onto CCKWs and preserve them as they make their way around the globe. CCKWs are nondispersive waves, meaning they tend to maintain their structure and can survive long enough to make several trips around the world over the course of several weeks. This gives them a noteworthy predictive value, but it takes some time and training to analyze CCKWs, which are too subtle to be seen with the naked eye on satellite images. One of the most useful tools is a Hovmöller diagram (see Figures 2 and 4 below), a time-versus-longitude plot often used to analyze areas where outgoing infrared radiation is consistently strong or weak. A CCKW will often foster and suppress enough clouds along its path to appear in a Hovmöller diagram, where its signal can be separated from the noise of day-to-day storminess. Sometimes a CCKW will overtake an active phase of the slower-moving Madden-Julian Oscillation, providing a twofold boost to showers and thunderstorms at that location before the CCKW moves on.
“It can be hard to see CCKWs for sure in these [diagrams], as these waves often destructively interfere from time to time with other equatorial waves and/or standing oscillations,” Ventrice told me. “Thus, you'll see a clear eastward propagation over some location, a break, then continuation of the signal over another location to the east at a later time.”
Figure 2. A Hovmöller diagram showing CCKW activity in July-August 2006 as traced by reductions in outgoing infrared radiation (encircled bands), averaged by longitude (bottom axis) over the main development region of the Atlantic (7.5°N to 12.5°N). Negative values of longitude are °W; positive values are °E. The CCKWs occur in the context of other, stronger features, so it can take careful analysis to find them. The green “D” near the center of the image indicates where and when Tropical Storm Debby became a named storm, supported by a CCKW passing from upper left to lower right through the “D.” Image credit: Michael Ventrice.
WSI scientist Michael Ventrice unraveled some of the links between CCKWs and hurricane formation several years ago, as part of his doctoral work at the University at Albany, State University of New York. He and colleagues at WSI now consult the CCKW regularly, and Ventrice has helped NHC develop code that allows the center to analyze CCKWs on a daily basis. “It seems to have really caught on among forecasters in the last three years,” Ventrice told me. For example, a forthcoming paper in Monthly Weather Review by Carl Schreck (North Carolina State University) surveys CCKWs around the globe and their role in tropical cyclogenesis.
Ventrice’s own research includes a set of three CCKW-related papers published in Monthly Weather Review in April 2012, July 2012, and June 2013. Ventrice’s dissertation is online, including an analysis of how a CCKW assisted in the formation of Tropical Storm Debby in 2006. There’s much more about CCKWs, including daily analyses, on Ventrice’s personal website. He also discussed CCKWs as part of a guest post on this blog last year.
How could a CCKW help give Danny a kick-start?
I was intrigued on Tuesday when a tweet from @MJVentrice credited a weak CCKW with assisting in the formation of the tropical depression that became Danny. According to Ventrice, this CCKW formed near the International Date Line around August 8, then amplified as it moved into the Atlantic basin. It’s now centered over the heart of the main development region, the swath of deep tropics in the north Atlantic that plays host to many of each year’s tropical cyclones. Over the last several days, this CCKW has likely enhanced low-level moisture and convection on its forward flank, in the eastern Atlantic, which would have helped nourish the easterly wave that became Danny as it came off the African coast. Only a minority of such waves make it to tropical-storm status; Ventrice believes that CCKWs are one of the key factors that can make or break such a system.
Figure 3. Tropical Storm Danny is now on the western edge of an eastward-moving CCKW, as indicated by this composite of Atlantic rain rates (shaded), departures from average wind at the 200-millibar height (vectors), and velocity potential anomalies at the 200-millibar height (contours). The velocity potential anomalies are related to upper-level divergence (blue contours) and convergence (red contours), with divergence favoring upward motion. For the latest version of this image, see Michael Ventrice’s website. Image credit: Michael Ventrice.
As Danny and the CCKW move in opposite directions, Danny is finding itself left behind. “The environment behind the CCKW can stay favorable for a couple of days, where you have enhanced low-level spinning, reduced vertical wind shear, and enhanced outflow,” Ventrice told me. (Carl Schreck’s new paper also finds that tropical cyclogenesis is favored for several days behind the crest of a CCKW.) However, Danny appears to be already feeling a lack of support, with the peak of the CCKW having long passed it by. “This may be the reason why we are seeing convection decouple from Danny this afternoon [Wednesday], as the low-level circulation associated with Danny is becoming exposed,” he said.
Fairly soon, Danny will encounter the more suppressed environment well behind the CCKW, together with the likelihood of higher wind shear and drier air favored by the ongoing El Niño regime. “I’ve seen a lot of cases where a mature tropical cyclone gets run over by the suppression behind a CCKW,” said Ventrice. “Can the hurricane create its own environment to protect itself from this?” One thing is for sure: the more latitude Danny gains, the less it will be influenced--for better or worse--by this CCKW. Meanwhile, it’s possible that the CCKW that gave Danny a boost will go on during the next week to favor development of another one or two easterly waves now over Africa, as suggested by some long-range model runs. After that, said Ventrice, “it doesn’t look like there’ll be much in the way of CCKW activity over the next two weeks.”
On Thursday morning, we’ll have a complete update on Danny, as well as Invest 93C in the Central Pacific and Typhoon Goni and Super Typhoon Atsani in the Northwest Pacific. Later on Thursday, watch for our summary of July’s global climate. In the meantime, here's a fascinating infrared loop of Atsani's core, featuring 2-km-resolution imagery from the Himiwari-8 satellite, courtesy of the University of Wisconsin/CIMSS. Jeff Masters is offline most of this week but will be fully back on board next week.
Bob Henson
Figure 4. A Hovmöller plot for May-September 2015 from the Cooperative Institute of Climate and Satellites-North Carolina (CICS-NC) showing variations in 200-mb zonal (west-to-east) wind speed by longitude over time. After August 17, the plot draws on long-range predictions from the NOAA Climate Forecast System model. Tropical cyclones over the Atlantic and Pacific are shown as lettered hurricane symbols. CCKWs are encircled in blue. A weak CCKW at lower right may have played a role in the development of Tropical Depression 11 (“E”) in the Northeast Pacific as well as Danny (“F”) in the Atlantic. Regularly updated plots are available from the Cooperative Institute of Climate and Satellites–North Carolina. Image credit:
By:
Bob Henson
, 4:42 PM GMT on August 20, 2015
Danny was largely stripped of its core convection (showers and thunderstorms) on Wednesday, as dry air filtered into its center, but the storm retained its overall structure and was able to rebuild central convection on Wednesday night, even managing to produce an eyewall formation and a visible eye over the last few hours. Danny’s quick intensification was facilitated by its small size (see Figure 3 below). Hurricane-force winds only spanned a region 20 miles in diameter on Thursday morning, with tropical-storm-force winds extending out up to 60 miles from the center. Smaller tropical cyclones are able to both intensify and weaken more rapidly, which makes intensity prediction especially challenging. That said, Danny’s rise to hurricane status was well forecast several days in advance by the recently upgraded HWRF model, and since Tuesday by the GFDL model. The leading statistics-based models, which are the most accurate guidance for intensity beyond about three days, also gave a solid heads-up that Danny could attain hurricane status by today.
Figure 1. A 1-km-resolution visible image of Tropical Storm Danny, collected by NOAA’s GOES-East floater satellite at 1315 GMT (11:15 am EDT) on Thursday, August 20. Image credit: University of Wisconsin/CIMSS.
Figure 2. Hurricane Danny as viewed from the International Space Station and tweeted on Thursday morning, August 20, by astronaut Scott Kelly. Image credit: NASA.
Figure 3. A side-by-side comparison of visible satellite imagery from Thursday, August 20, for Super Typhoon Atsani in the Pacific (left) and Hurricane Danny in the Atlantic (right), both at the same scale, shows how much tropical cyclones can vary in size. Even smaller systems like Danny can be devastating if they grow intense enough and strike a highly populated area. Composite image credit: Mark Lander, University of Guam.
The outlook for Danny
Despite the overnight growth spurt, Danny’s future as a hurricane remains highly uncertain. One of the two main obstacles it faces is a huge zone of relatively dry, dusty air that extends across most of the Atlantic around 20°N latitude (see Figure 4). Any large-scale intrusion of this air into Danny’s circulation would tamp down the instability that fuels convection. Thus far, Danny has been able to generate and consolidate enough shower and thunderstorm activity to fight off injections of dry air--another benefit of its small size. As it slowly gains latitude, Danny will be at increasing risk of falling victim to this zone of dry air, provided it does not shift to the northeast in tandem with Danny’s northwestward motion.
Figure 4. Hurricane Danny (small white area near the center of the Atlantic tropics) is tucked just south of a large belt of dry, dusty air, generated in part by the Saharan air layer (SAL) moving west from Africa. Danny’s projected west-northwest motion will bring it closer to this dry air mass. Image credit: University of Wisconsin/CIMSS and NOAA Hurricane Research Division.
Danny’s other nemesis is vertical wind shear, a perennial feature in the North Atlantic tropics during El Niño years. The widespread rising of warm air over the eastern tropical Pacific during El Niño helps foster unusually strong west winds at upper levels, pushing away from the Niño region into the Caribbean and western Atlantic. Such shear can easily disrupt the chimney-like vertical structure that helps to maintain a tropical cyclone’s strength. Currently, wind shear over the Caribbean is below the record values observed earlier this summer, but values of 30 - 60 mph remain widespread. (Anything above 20 knots, or about 23 mph, is problematic for tropical cyclone development.) For now, shear over Danny remains low, in part because its potent convection has produced a small zone of high pressure overhead. This weekend, Danny will be hard-pressed to avoid encountering a belt of higher shear, which would not only jeopardize its structure but also help push dry, dusty air into its circulation. If Danny survives that passage as a well-structured tropical cyclone, then it may encounter somewhat lower shear values ahead of its path early next week (see Figure 5), as a weak but persistent upper-level low is predicted to move northward from the Bahamas and a ridge builds in to replace it.
Figure 5. Predicted vertical wind shear between the 200 mb and 850 mb altitudes at at 0600 GMT on Tuesday, August 24, near the end of the five-day outlook shown below in Figure 6. Shear values above 20 knots (23 mph) are generally destructive to tropical cyclone circulation. Image credit: Levi Cowan, tropicaltidbits.com.
Figure 6. NHC’s outlook for Danny as of 11:00 am EDT Thursday.
Computer forecast models remain in general agreement on Danny’s path over the next five days, a west-northwest trek that would bring it close to the northernmost Leeward Islands, and perhaps eventually Puerto Rico, by early next week. NHC predicts that Danny will maintain Category 1 hurricane strength throughout the next four days, then weaken to strong tropical-storm levels by Day 5 (Tuesday, August 24). Assuming that Danny follows the projected track, its intensity would be modulated not only by the factors above but also by any interaction with islands. Danny should gradually grow in size, but if it remains a compact cyclone, any interaction with mountainous islands could have an unusually large detrimental effect on its intensity. Danny’s intensity forecast is more uncertain than usual because of its very small size: day-to-day conditions could produce dramatic spikes in strength, both upward and downward. Even so, the statistical and dynamical model guidance suggests that Danny is unlikely to strengthen beyond Category 1 levels over the next five days.
Figure 7. This infrared image from the GOES-East satellite, from 1445 GMT (10:45 am EDT) shows Invest 97L (top center) dwarfing Hurricane Danny (bottom center) in size, if not in organization. Image credit: NOAA/NHC.
Another disturbance in the North Atlantic
A disorganized cluster of convection--actually much larger than the entire circulation of Danny--has been designated Invest 97L. The storminess is associated with the upper-level low mentioned above, intersecting with a weak surface front. Sea-surface temperatures near 97L are 28-29°C (82-84°C), about 1-2°C above average, which is more than adequate for tropical development. Statistical guidance indicates that 97L could evolve into a subtropical or tropical storm as it drifts northward, but neither of the most reliable dynamical models for short-term intensity trends--the HWRF and GFDL--developed 97L in their 0000Z Thursday model runs. NHC gives 97L a 20% chance of development in the next two days and a 60% chance in the next five days.


Fig 22a - Active Atlantic Ocean Tropical
Waves

Fig 23 - 48 Hour Tropical Storm Probability

Fig 23a - Hurricane Danny Distance from Roatan
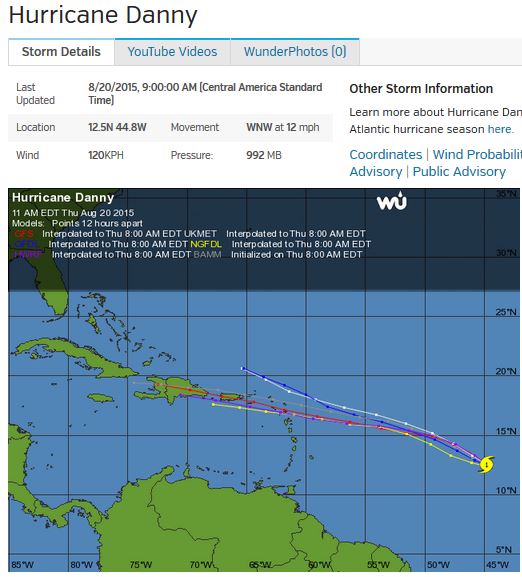
Fig 23b - Hurricane Danny Computer Models

Fig 23c - Hurricane Danny Storm Coordinates
low tide 6:43 am LT Sunrise – 5:33 am LT>76° East
high tide 2:44 pm LT Sunset – 6:09 pm LT < 283° West
low tide 7:38 pm LT Moon Rise – 10:16 am LT> 97° East
high tide 12:43 am LT Moon Set – 10:21 pm LT < 261° West
high tide 2:44 pm LT Sunset – 6:09 pm LT < 283° West
low tide 7:38 pm LT Moon Rise – 10:16 am LT> 97° East
high tide 12:43 am LT Moon Set – 10:21 pm LT < 261° West

No comments:
Post a Comment